How Do You Measure Carbon in a Forest?
For Winrock’s Ecosystem Services Team it required tape measures, GPS devices, first-aid kits and countless weeks in Guyana’s wilderness.
By Chris Warren
As part of its Reducing Emissions from Deforestation and Forest Degradation (REDD+) agreement with Norway, Guyana had to estimate the carbon contained in its expansive forests. Though a lot of rigorous analysis went into developing the best way to do this — a process Winrock spearheaded — getting it right ultimately required sending teams from the Guyana Forestry Commission (GFC) armed with tape measures, clipboards and GPS devices out into the forest to measure trees.
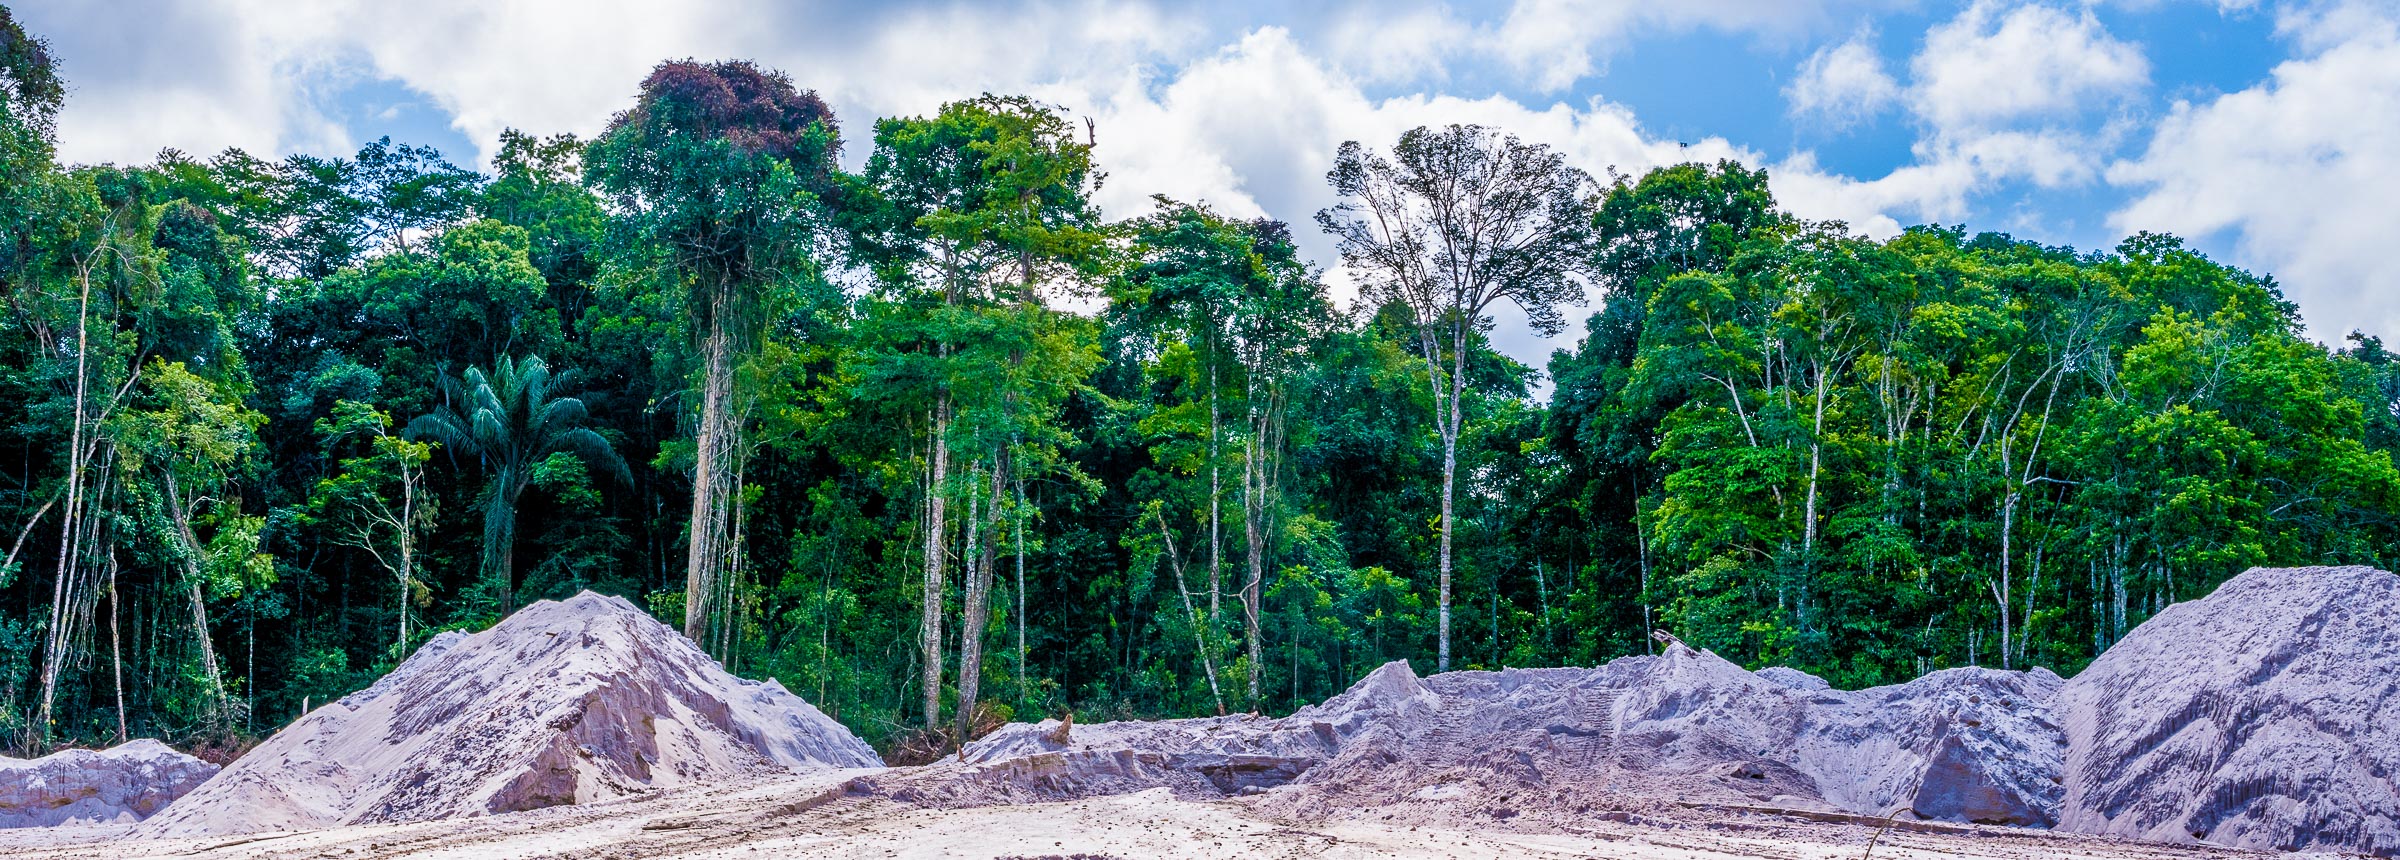
Why? For one, you can’t simply hold up a monitor to a tree trunk and take carbon readings. Instead, it’s necessary to estimate forest carbon based on a tree’s biomass. Let’s unpack that a bit. Trees draw carbon from the atmosphere through the photosynthesis process that all plants use for food and to grow. That carbon is then locked into the tree as wood, or biomass. When forests are cleared for mining or agriculture, carbon is released back into the atmosphere (though preventing that from happening is what the Guyana-Norway deal was all about).
Winrock worked with the GFC to develop a handbook and train field staff to collect data that could then be used to estimate Guyana’s forest carbon stocks. It’s an approach and method that is both efficient and cost-effective given the enormity of Guyana’s forests and the lack of existing data. And it has become an important example of a practical approach for countries participating in REDD+ that are starting off with little data. Some of the essential steps include:
- Selecting plots to measure: It would be nice if you could measure one small stand of trees and then use the findings to make assumptions about carbon levels in the rest of Guyana’s forests. But anyone who has actually been in a forest knows that tree sizes and species (and therefore carbon) vary considerably from place to place. Which is why Winrock and the GFC opted to divide Guyana into sections based on accessibility (a proxy for the likelihood they would be degraded or deforested). Within these sections, teams were sent to a sizable number of randomly selected forest plots to do their measurements.
- Actually finding the plot: In a country that’s 85-percent covered by forests and has very few roads, that can be harder than it might seem. But GPS devices and a willingness to tromp through thick forests made it possible.
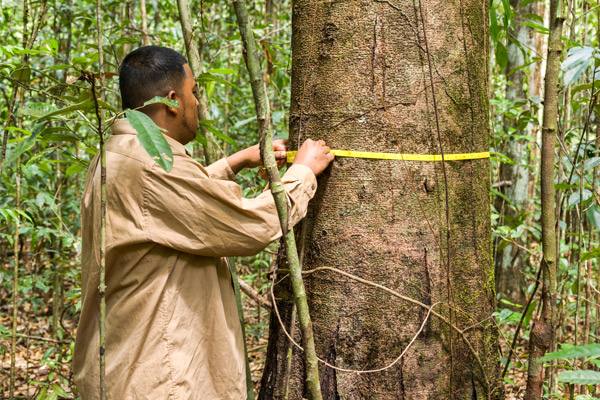
- Circular measurements: Once a plot was located, teams literally began measuring the diameter of trees located within a series of concentric circles around that center plot point. Within a two-meter radius, for instance, all saplings with diameters less than five centimeters were measured; within a six-meter radius, all trees with a diameter between five and 25 centimeters were measured; and on it went, out to a 20-meter radius of the original plot point and trees with diameters greater than 50 centimeters. All of this work involved marking already measured trees so as not to duplicate efforts — and also putting the tape measure around the trees at exactly the right spot — 1.3 meters up the trunk, which is known as diameter at breast height, or DBH. Besides measuring the trees, GFC staff also noted the species of the tree because it is an indication of how dense its biomass is.
- Not getting lost (or bitten): Guyana’s forests are massive and teeming with plant and animal life. These are both great things, but they also meant safety was important. The handbook GFC field teams used included instructions to bring along cell and satellite phones, first-aid kits and to ensure that nearby medical facilities had the right medicine to treat poisonous snakebites.
- Translating into carbon: What happened to all of the data the GFC labored for years to put together? It was fed into equations that use biomass measurements and covert it into carbon.
Related Projects