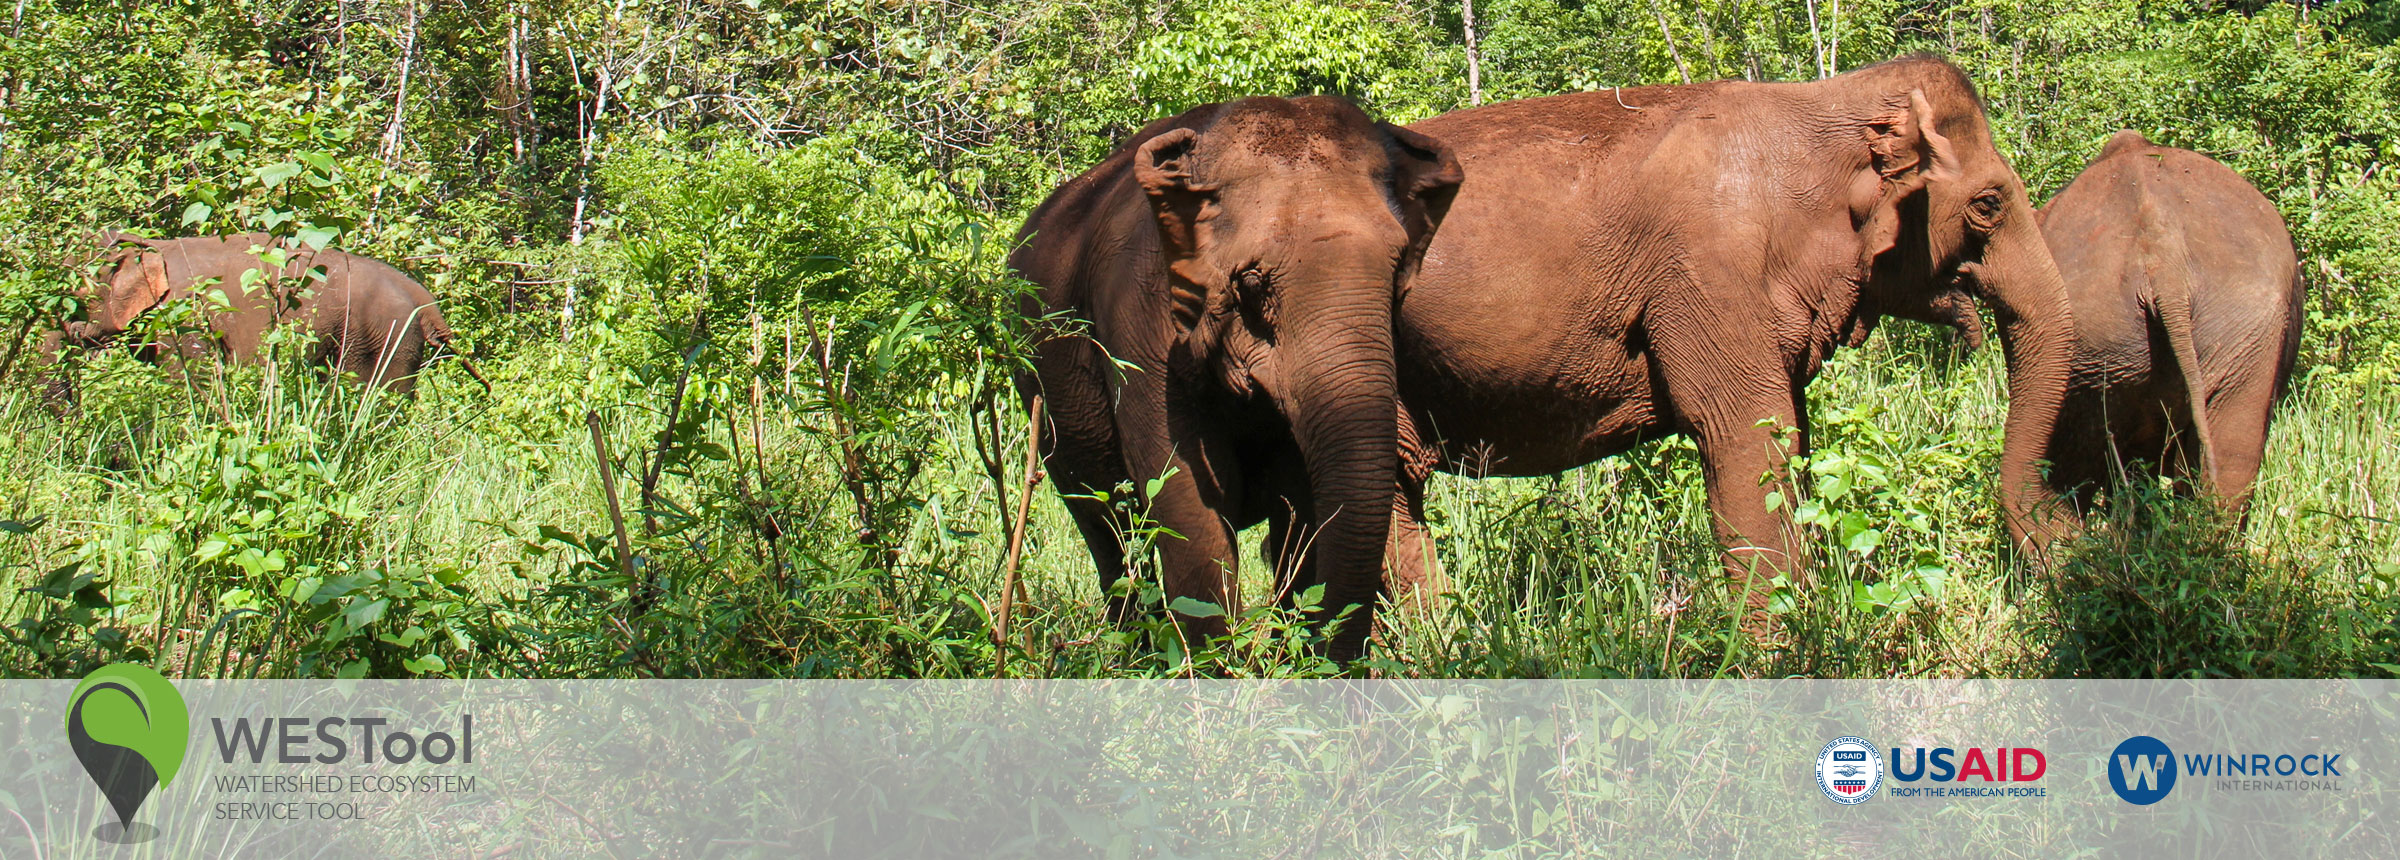
Forests and Biodiversity
![]()


Forests protect water sources and soil, store carbon, and provide habitat for plants, animals and microorganisms. Forests and biodiversity are intrinsically linked, as the complex web of life within forests maintains the very conditions needed for the forests themselves to thrive.
Cambodia is part of the Indo-Burma Biodiversity Hotspot and is considered one of the world’s top 10 biodiversity regions. It is also home to a great number of species on the IUCN Red List of threatened or endangered species, including 39 species of mammals, 36 species of birds, 38 species of vascular plants, 13 species of reptiles, and 12 species of amphibians[1].
The constant warm temperatures and abundant rainfall typical of Southeast Asia’s tropical climates offer conditions that allow for a wide variety of species to procreate and thrive all year long. This leads to higher rates of evolution, resulting in greater biodiversity.
The importance of forests and biodiversity in Cambodia is underlined by the fact that the country’s industry, agriculture and fishing sectors are all tied to the health of its biodiverse forests and ecosystems. In particular, the well-being of its freshwater ecosystems is enormously important to the majority (88 percent) of Cambodians who rely on fishing and fish-related activities for their livelihood and income generation[1].
Despite this, forests are often economically undervalued and subject to clearing for more productive agricultural land. Understanding how the ecosystem services provided by forests, including biodiversity, vary across the landscape is critical for Cambodia as it seeks to maintain a sustainable balance of agricultural productivity and ecosystem services. The WESTool’s Forests & Biodiversity tab offers a unique analysis by combining maps and analyses of key ecosystem services, allowing users to comprehensively understand how these services vary across Cambodia’s landscapes.
Comparing ecosystem services to potential agricultural production
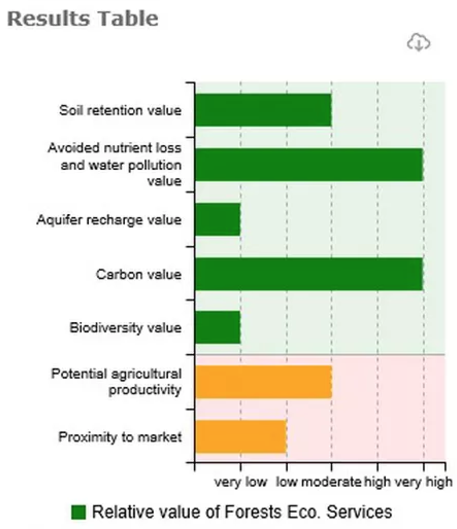 By clicking the ‘Eco. Prod.’ Icon next to the layers icon on the left side of the page in the Forests & Biodiversity tab, you can instantly see an analysis that compares an array of ecosystem services to potential agricultural productivity for any selected area on the map.
The WESTool produces a graph like the example to the right that summarizes the relative values of ecosystem services for the selected area.
This analysis was produced by combining data layers, which can be viewed individually or simultaneously on the map in the Forests & Biodiversity tab. A description of those data layers and the approach to valuing each ecosystem service is provided below.
Data layers for assessing ecosystem services
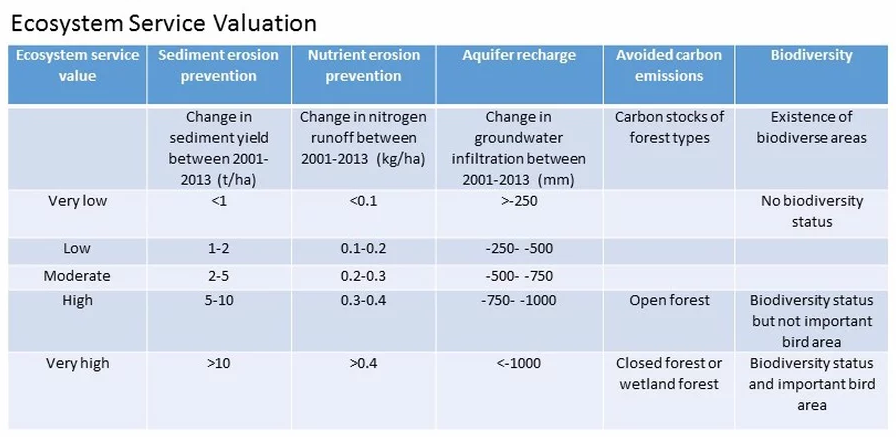
BIODIVERSITY: Areas of particularly high biodiversity can be identified by clicking the ‘Biodiversity’ layer. This “Key Biodiversity Areas of Cambodia” data layer was developed by BirdLife International, Conservation International, the Critical Ecosystem Partnership Fund and WWF Cambodia Programme[2]. While this map is by no means comprehensive and may overlook other important biodiversity hotspots, it provides a basic indication of which areas have already been identified as having high biodiversity values.
The WESTool allows users to consider biodiversity in their land use decisions by showing what areas have been classified as biodiversity hotspots in Cambodia.
LAND COVER IN CAMBODIA: This layer shows what land use in Cambodia was in 2013. It was created by combining several sources of data: (1) University of Maryland’s layers of tree cover and forest loss between 2001-2013[3], (2) Wohlfart et al. (2014) map of dry deciduous dipterocarp forests[4], and (3) the European Space Agency’s Globe Land Cover map[5].
SEDIMENT EROSION PREVENTION: This layer was created through hydrological modeling of the Mekong river basin in Cambodia using land cover maps from 2001 and 2013. As forest cover was lost over that time period, sediment erosion increased. As a result, forest areas that saw larger increases in sediment erosion were deemed to have higher value for sediment erosion potential. Remaining forest areas as of 2013 were assigned a sediment erosion prevention value based on the estimated average value of sediment erosion prevention that occurred on similar forests (having the same slope and soil type) that were cleared between 2001 and 2013.
NUTRIENT EROSION PREVENTION: This layer was also created through hydrological modeling, using a similar method as the sediment erosion layer. Instead of sediment, however, change in nitrogen runoff values between 2001 and 2013 was used.
AQUIFER RECHARGE: This layer was developed through hydrological modeling, using a similar method as the sediment erosion layer. Instead of sediment, however, change in groundwater infiltration values between 2001 and 2013 was used. As forest cover is lost, more water runs off the land’s surface, reducing infiltration into the aquifer.
AVOIDED CARBON EMISSIONS: Since deforestation results in carbon emissions, the ecosystem service of avoided carbon emissions was estimated by developing a data layer that reflects the emissions clearing standing forests would result in. The Land Cover and Cambodia layer described above was combined with estimated carbon stocks for standing forests across Cambodia (as of 2013), sourced from field datasets [6]. As different forest types across Cambodia contain different average carbon stocks (i.e., open forests have less carbon stocks than closed and wetland forests, and therefore would cause more emissions if cleared), forest types with higher carbon stocks were assigned a higher value of avoided carbon emissions.
Data layers for assessing agricultural productivity
POTENTIAL AGRICULTURAL PRODUCTIVITY: This layer was created by combining information about variables that affect agricultural productivity: (1) annual precipitation (from Global WorldClim database)[7], (2) available water content of the soil (an output from hydrological modeling), (3) slope (calculated from a digital elevation model), and (4) soil fertility (obtained from Open Development Cambodia [8]). To combine this information to produce values for agricultural activity across Cambodia’s landscapes, the values were weighted according to their relative contribution to agricultural productivity and summed across the layers. The table below describes this valuation.

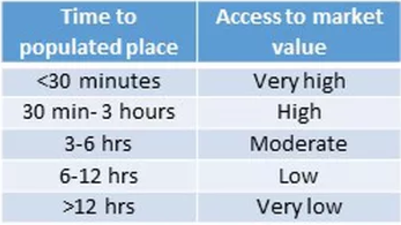 ACCESS TO MARKET: This layer was obtained from the European Union Joint Research Center’s global accessibility map[9]. This global map predicts the travel time to cities with a population of over 50,000, making it a useful proxy for predicting the distance farmers must travel to major markets to sell their product. Travel times were averaged across communes and assigned a value as detailed in this table.
References
[1] BirdLife International, Conservational International, the Critical Ecosystem Partnership Fund and WWF Cambodia Programme. Key Biodiversity Areas of Cambodia. BirdLife International, Cambridge, UK and Conservational International, Arlington, VA, 2013. Save Cambodia’s Wildlife. “Biodiversity.” Atlas of Cambodia: maps on socio- economic development and environment. Second ed. Phnom Penh, 2014. 31-36. Print. http://www.opendevelopmentcambodia.net/
[2] Cambodia – Country Profile. Convention on Biological Diversity. Available at: https://www.cbd.int/countries/profile/default.shtml?country=kh#facts
[3] Hansen MC, Potapov PV, Moore R, Hancher M, Turubanova SA, Tyukavina A, Thau D, Stehman SV, Goetz SJ, Loveland TR, Kommareddy A, Egorov A, Chini L, Justice CO, Townshend JRG (2013) High-resolution global maps of 21st century forest cover change. Science: 342 (6160), 850-853.
[4]Wohlfart, Christian, Martin Wegmann, and Peter Leimgruber. “Mapping threatened dry deciduous dipterocarp forest in South-east Asia for conservation management.” Tropical Conservation Science 7, no. 4 (2014): 597-613.
[5] http://www.esa-landcover-cci.org/?q=node/158
[6] Carbon stock values from the following inventories were averaged: Seima REDD (WCS), Prey Long Protected Forest (CI), Oddar Menchey PD, and Central Cardamon Protected Forest (FFI).
[7]Hijmans, R.J., S.E. Cameron, J.L. Parra, P.G. Jones and A. Jarvis, 2005. Very high resolution interpolated climate surfaces for global land areas. International Journal of Climatology 25: 1965-1978.
[8] http://www.opendevelopmentcambodia.net/tag/soil-fertility/
[9]Nelson, A. (2008) Estimated travel time to the nearest city of 50,000 or more people in year 2000. Global Environment Monitoring Unit – Joint Research Centre of the European Commission, Ispra Italy. Available at http://bioval.jrc.ec.europa.eu/products/gam/
Contact: Michael Netzer, Program Officer, Winrock International. mnetzer@winrock.org
How to Cite WESTool
Watershed Ecosystem Service Tool (WESTool). 2017. Beta Version 1. https://winrock.org/westool/. Winrock International
![]()