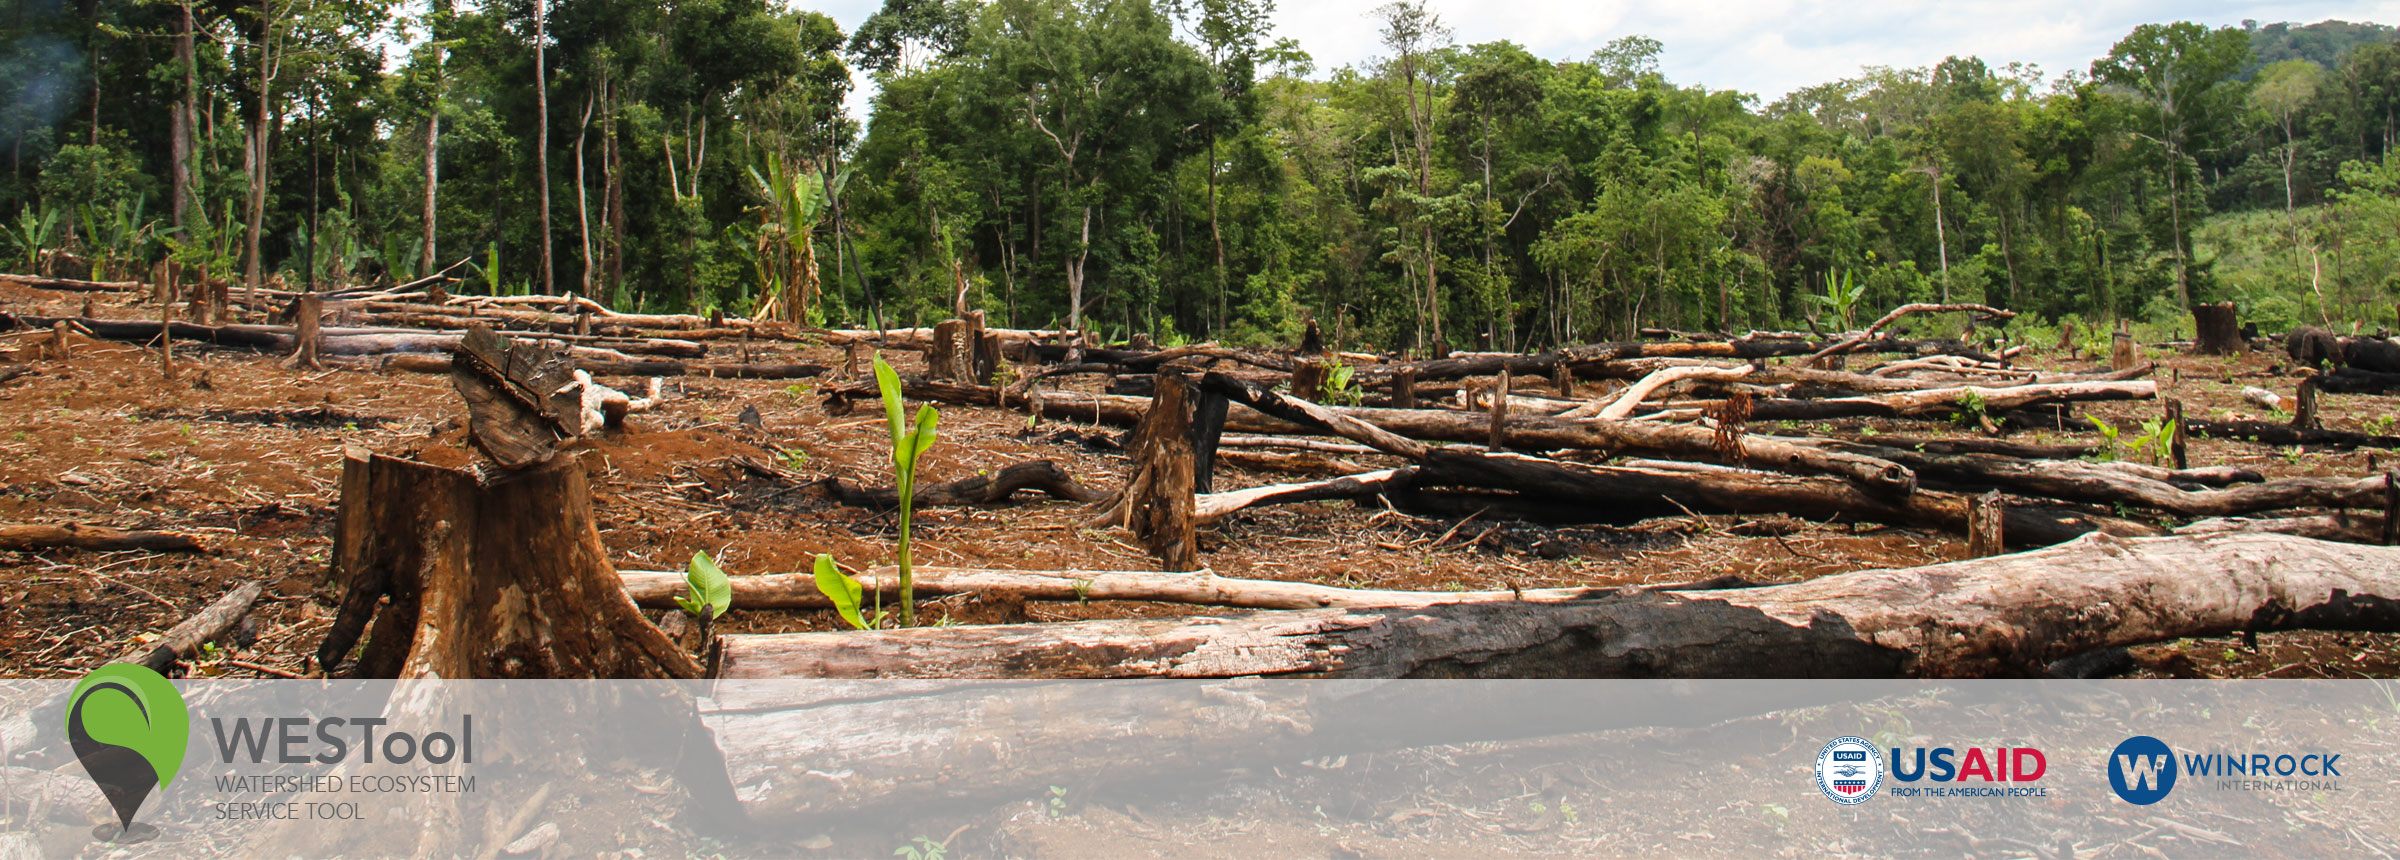
Greenhouse Gas Emissions from Land Use and Land Use Change
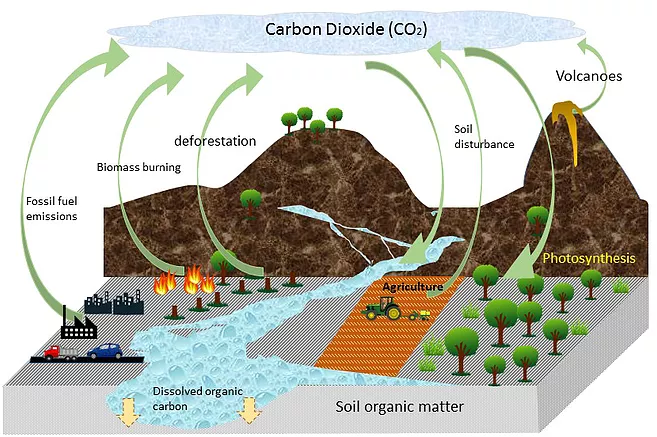
Forests are often referred to as the “lungs of our planet.” Through photosynthesis, they inhale (sequester) carbon dioxide (CO2) from the atmosphere and exhale oxygen (O2). As trees and vegetation grow, they store the carbon which makes up about half of their total biomass.
Forests store large amounts of carbon in their biomass and perform the very important ecosystem service of helping to regulate the global climate. When forests are converted to other land uses, they release their carbon as carbon dioxide, an important greenhouse gas. Increases in emissions of carbon dioxide and other greenhouse gases have led to global climate change.
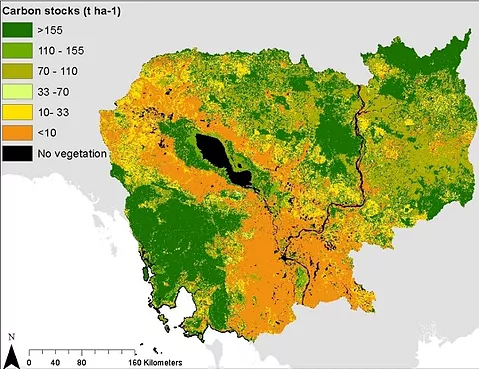
Forests in Cambodia store large amounts of carbon. Its tropical evergreen forests store an estimated 202 tonnes of carbon per hectare (t C/ha) and its deciduous forests store 109 t C/ha [1]. In contrast, croplands only store 8-30 t C/ha and plantations from 32-91 t C/ha.
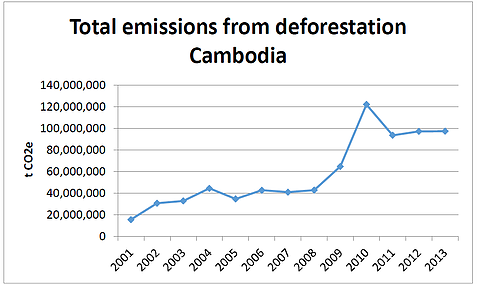
Deforestation rates in Cambodia are on the rise, leading to greater emissions over the past decade, as shown in the graph below.
Estimating emissions from deforestation
Global satellites track changes in land use over time. They can be used to estimate how much deforestation has occurred, and therefore estimate emissions from past land use change. The WESTool estimated the extent of historical deforestation by combining the University of Maryland’s layers of tree cover and forest loss between 2001-2013[2] with a dataset developed by Wohlfart et al. (2014)[3] that shows the area of the the dry deciduous dipterocarp forests of Southeast Asia.
Estimating emissions from land use change also requires information on the carbon stocks in the land uses before and after change. Estimated carbon emissions represent the difference in carbon stocks between the two land uses. In the WESTool, carbon stocks for Cambodia’s forests came from field research datasets[1] and the Intergovernmental Panel on Climate Change (IPCC) default values[4].
Estimating emissions from agriculture
FERTILIZER AND TILLAGE: Nitrogen oxide (N2O) is a greenhouse gas emission that results from applying certain agricultural fertilizers. Nitrogen oxide emissions often increase as a result of deforestation, since forests are often to establish agriculture. Annual emissions from nitrogen fertilizer in the WESTool were estimated following IPCC guidelines (AFOLU Chapter 11) and data from Cambodia’s Annual Report for Agriculture Forestry and Fisheries 2013-2014 [5],[6].
SOIL DISTURBANCE: Agriculture often involves tilling and disturbing soils, which releases carbon stored in the soils. To estimate these emissions, average soil organic carbon values for mineral soil before deforestation were derived from the FAO Harmonized Soil Database (40 t C ha-1 and for organic soil 92 t C ha-1) [7] and soil carbon stocks after forest conversion to cropland were calculated based on soil stock change factors for land use, management sourced from the IPCC Guidelines (2006) [4]. Since soil emissions persist for about 20 years after the initial disturbance, only croplands that were developed after 2000 were assumed to be emitting (and no data was available prior to 2000).
FLOODED RICE FIELDS: Flooded rice production results in methane (CH4) emissions, a potent greenhouse gas. The WESTool applied the estimated methane emissions from flooded rice fields in Cambodia derived by Vibol and Towprayoon (2009). The average CH4 emissions were reported as 3.8 t CO2e ha-1 y-1.
Forest growth
CARBON SEQUESTRATION IN NATURAL FORESTS: Over time, trees sequester carbon dioxide from the atmosphere and store it in their biomass as carbon. In the WESTool, the average annual carbon accumulation rates for standing forests were sourced from the IPCC 2006 Guidelines for all natural forest types in Cambodia (2.03t C ha-1 y-1)[4].
CARBON SEQUESTRATION IN AGROFORESTRY SYSTEMS: Forest growth for the different agroforestry types in Cambodia (rubber, cashew, oil palm, etc.) was calculated by applying the average annual growth to all native and commercially planted species, as estimated using the Chapman-Richards growth equation [8].
References
[1] Based on average carbon stocks measured in 1) WCS’s field data for the Seima REDD project, 2) field data provided by CI from Prey Lang Protected, 3) published field data from the Oddar Menchey REDD Project Document, and 4) field data provided by FFI conducted in the Cardamon Protection Forest
[2] Hansen MC, Potapov PV, Moore R, Hancher M, Turubanova SA, Tyukavina A, Thau D, Stehman SV, Goetz SJ, Loveland TR, Kommareddy A, Egorov A, Chini L, Justice CO, Townshend JRG (2013) High-resolution global maps of 21st century forest cover change. Science: 342 (6160), 850-853.
[3]Wohlfart, Christian, Martin Wegmann, and Peter Leimgruber. “Mapping threatened dry deciduous dipterocarp forest in South-east Asia for conservation management.” Tropical Conservation Science 7, no. 4 (2014): 597-613.
[4] IPCC. 2006. 2006 IPCC Guidelines for National Greenhouse Gas Inventories, Prepared by the National Greenhouse Gas Inventories Programme, Eggleston H.S., Buendia L., Miwa K., Ngara T. and Tanabe K. (eds). Published: IGES, Japan. Volume 4 Agriculture, Forestry and Other Land Use. Paustian, K, Ravindranath, N.H. and Van Amstel, A (coordinating lead authors). Available at: http://www.ipcc-nggip.iges.or.jp/public/2006gl/vol1.htm
[5] Vibol, S., and S. Towprayoon. “Estimation of methane and nitrous oxide emissions from rice field with rice straw management in Cambodia.”Environmental monitoring and assessment 161, no. 1-4 (2010): 301-313.
[6] MAFF. 2014. “Annual Report for Agriculture Forestry and Fisheries 2013-2014 and Directions for 2014-2015.”
[7] Harmonized World Soil Database. 2012. Version 1.2. Available at: http://webarchive.iiasa.ac.at/Research/LUC/External-World-soil-database/HTML/
[8] Pienaar, L.V. and K.J. Turnbull. 1973. The Chapman-Richards Generalization of Von Bertalanffy’s Growth Model for Basal Area Growth and Yield in Even-Aged Stands. Forest Science 19 (1): 2-22.
Contact: Michael Netzer, Program Officer, Winrock International. mnetzer@winrock.org
How to Cite WESTool
Watershed Ecosystem Service Tool (WESTool). 2017. Beta Version 1. https://winrock.org/westool/. Winrock International


